Overview
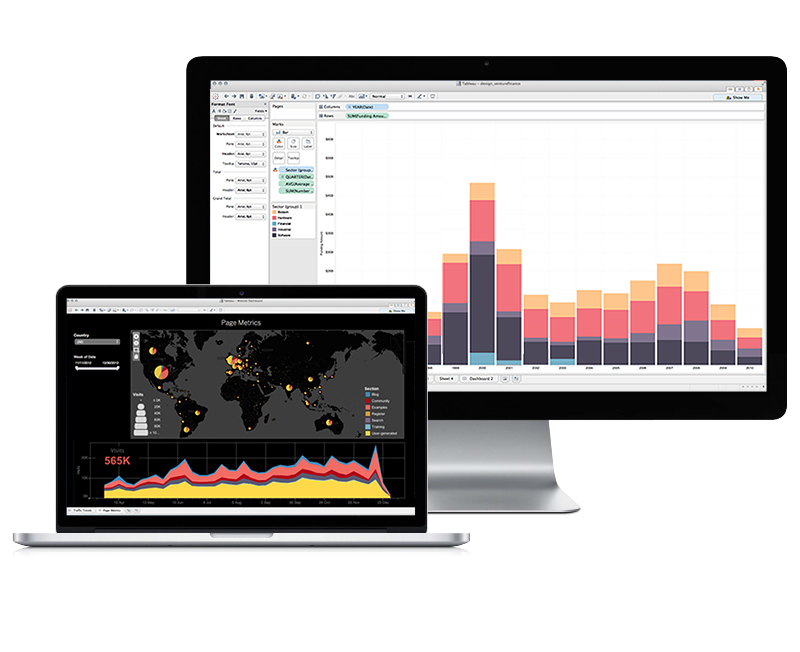
Tableau shifts BI into the do-it-now era with the easiest, fastest and most agile solution in the market. Tableau’s award-winning software delivers fast self-service analytics, visualization and rapid-fire business intelligence. The result? Anyone can get answers from data quickly. From executive dashboards to ad-hoc reports, Tableau lets you share mobile and browser-based, interactive analytics in a few clicks. Used by more than 35,000 customer accounts worldwide, and ranked by Gartner as the fastest growing BI Company in the world, Tableau makes business users happy and saves IT time and money. Tableau Software helps people see and understand data. Used by more than 35,000 customer accounts worldwide, Tableau’s award-winning software delivers fast analytics and rapid-fire business intelligence. Create visualizations and dashboards in minutes, then share in seconds. The result? You get answers from data quickly, with no programming required.
Features
Visual analysis in a click: Powerful analytical tools—at your fingertips. Filter data dynamically, split trends across different categories or run an in-depth cohort analysis. Double-click geographic fields to put data on an interactive map. All without writing a single line of code.
Deep statistics: Go deeper into your data with new calculations on existing data. Drag reference lines and forecasts, build box plots and see statistical summaries of your data. Experiment with trend analyses, regressions, correlations, and much more. PhD not required
Metadata management: Make better sense of your available data—quickly and easily. Rename fields and modify number formats. Split your data into multiple fields or combine fields into groups. Create subsets of your data by simply selecting groups of points. Use those sets to filter other views. Now it’s easy for you to make your data understandable to everyone.
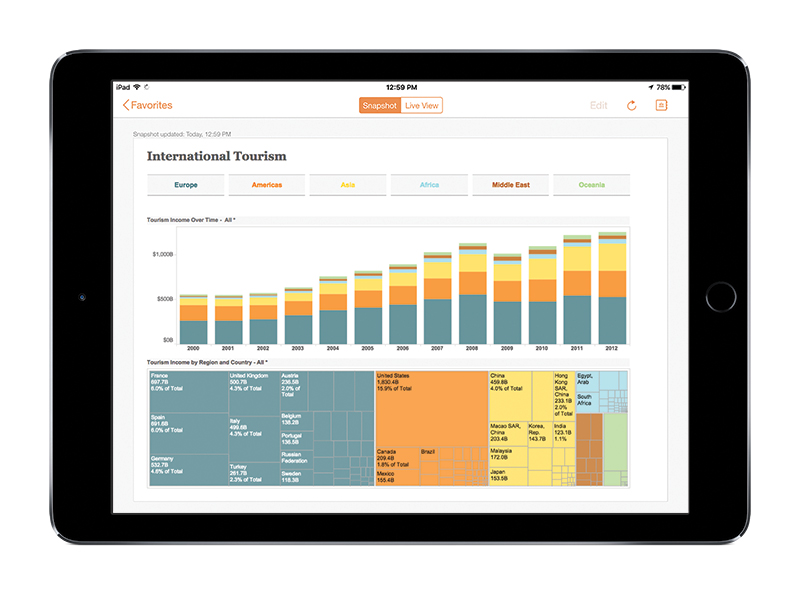
Best practices built in: You get the benefit of years of research on the best ways to represent data, built right into your workflow. Optimized color schemes, automatic chart types and elegant design. Communicate insight in the most effective way, automatically.
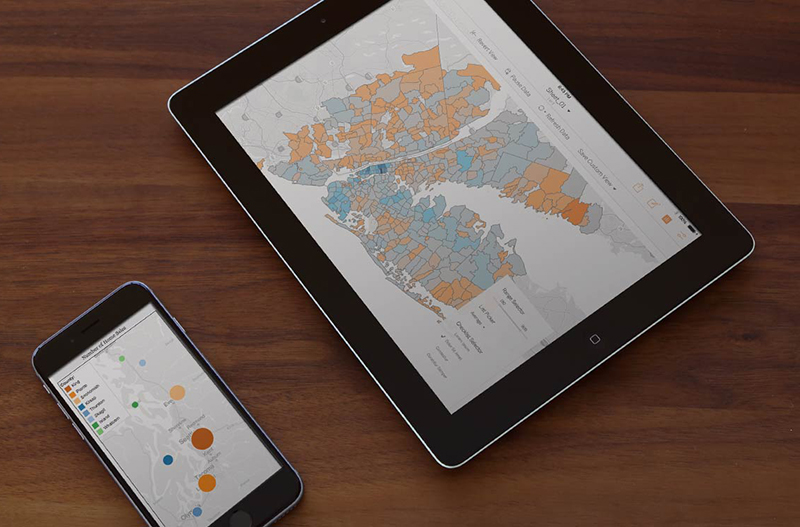
Data engine: When you want to take data offline or bring it in-memory, Tableau’s Data Engine lets you extract data for ad hoc analysis of massive data in seconds. It combines advances in database and computer graphics technology to make even huge datasets possible to analyze on a laptop or mobile device.
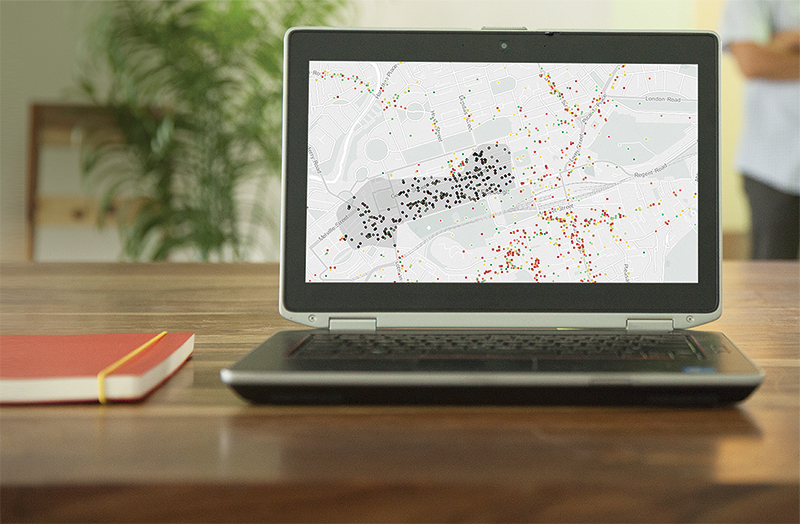
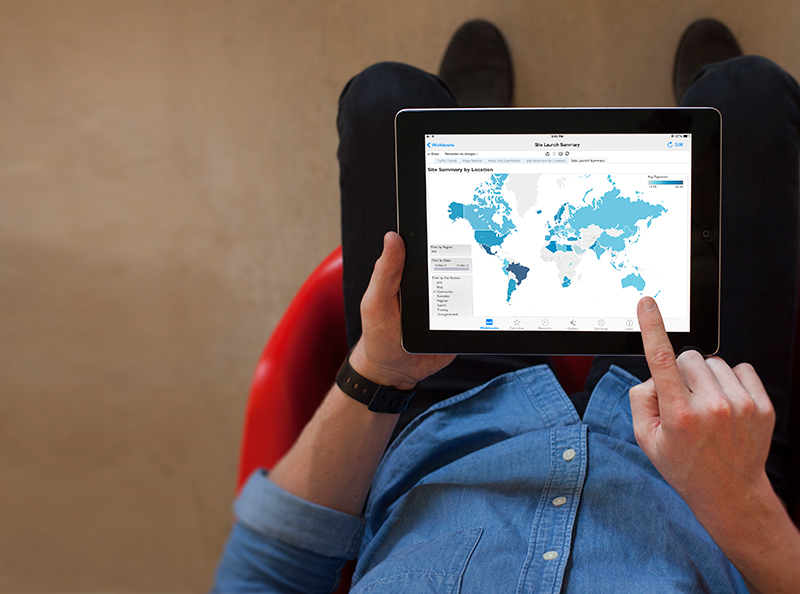
Mapping: Beautiful, interactive maps are key to understanding place. Double-click geographic fields to put data on a map. Pan, zoom, filter or search to focus on your insights. And with detailed map data worldwide, you can answer questions whether you are working with Australian postcodes or Brazilian municipalities.
-
-

- Microsoft's TrueType core font...3.2B
- MinGW - Minimalist GNU for Win...1.9B
- Notepad++ Plugin Manager...1.9B
- VLC media player901M
- eMule695.6M
- SAP NetWeaver Server Adapter f...641.1M
- PortableApps.com639M
- FileZilla®635.5M
- Vuze - Azureus544.7M
- 7-Zip429.5M
- Apache OpenOffice419.6M
- Ares Galaxy412.8M
- AutoClicker371.8M
- AutoAP300.4M
- Ubuntuzilla: Mozilla Software ...280.8M
- Scrollout F1207M
- KeePass178M
- XAMPP172.5M
- Anti-Spam SMTP Proxy Server...170M
- WinSCP160.8M


